Weekly Summary: May 17 – 21, 2021
When it comes to economic recovery measures, the COVID-19 crisis has put the Great Recession to shame. This time around, the U.S.’s fiscal and monetary policy response has been massive, quick—and potentially fertile for unintended consequences. At the same time, cryptocurrency has been on a roller coaster, while the relatively calmer rides of equities and sector rotations remain somewhat unpredictable. We have been focusing on inflation—specifically, whether rising prices will become persistent, which finally appears to be many investors’ focus as well. It seems that each equity decline over the past two weeks has been blamed on inflationary concerns, even on days when there was no news on inflation itself. Indeed, the volatility we anticipated has arrived.
Key observations:
- This week underscored how quickly perceptions—and ensuing market reactions—can change. Bitcoin volatility was the prime, most extreme example.
- Economic growth, although still very powerful, is showing signs of slowing, while prices continue to exceed expectations.
- The volatility in many markets this week confirms the benefit of investment diversification. The speed and frequency of current market gyrations are simply too unpredictable. Thus it’s all about “pre-positioning” and taking advantage of price movements to snag desirable opportunities at attractive values.
The upshot: We expect to continue to keep an eye on—and take advantage of—volatility.
Bitcoin’s cryptic ride
Let’s start with the kings of volatility, cryptocurrencies. The most prominent, of course, is Bitcoin. A risk asset—not a hedge—Bitcoin is based on blockchain technology, a distributed ledger (no central control), in which all transactions are tracked, recorded, and unalterable. There are no intermediaries, and traders can choose to be anonymous. It’s also finite: Only 21 million Bitcoins can be “mined” (created on a supercomputer), and each mining session results in fewer new Bitcoins—at exponentially higher environmental costs due to the huge amounts of electricity needed to process them. For example, according to Cambridge University, in mid-April global power demanded by Bitcoin’s network likely was about 4% higher than Argentina’s total, mostly coal-fueled electricity generation for 2019, resulting in CO2 emissions about 60% higher than Argentina’s.
Bitcoin also has a well-known history of extreme volatility. Created when ample liquidity existed in response to the 2008 financial crisis, Bitcoin gained enormous credibility on Oct. 21, 2020, when PayPal announced that it would launch a new service enabling users to buy, hold and sell cryptocurrencies directly from their PayPal account. Bitcoin’s price was $13,799 that day…and would eventually soar above $63,000—yet also face four subsequent significant corrections of about 25%, all prior to this month’s extreme downturn.
Bitcoin/USD: 9/30/20 – 5/20/21

Source: Bloomberg
Why the latest correction? For one thing, last week Elon Musk expressed concerns about the negative environmental impact of mining and transacting with Bitcoin—and said that Tesla would no longer accept Bitcoin as payment for its vehicles. (Notably, Tesla did not sell any of its Bitcoin holdings.) Meanwhile, on May 18, JPMorgan noted that over the past month, institutions have been liquidating Bitcoin futures in a steep and sustained manner. And on the same day, the People’s Bank of China (PBOC)—where cryptocurrencies have been restricted since 2017—announced that Chinese financial institutions and markets would abandon all use of such virtual currencies. That the PBOC may be further along than any central bank in developing its own digital currency to at least partially replace paper money and coins seems the height of irony, if not cynicism.
The network effect
Cryptocurrencies should continue to benefit from the “network effect” as more people get involved with such currencies—akin to how companies such as Google, Amazon, and Facebook benefitted from increased internet usage. Will Bitcoin remain a key beneficiary? Will other cryptocurrencies? Many analysts have very high target prices, but calculating an appropriate value for Bitcoin remains elusive. (For a detailed discussion of cryptocurrencies, listen to the May 17 Fireside Chat[IH1] , hosted by NewEdge’s Robert Sechan with guests Tom Lee and Anthony Scaramucci.)
How much volatility is OK?
Bitcoin’s fits and starts brings into focus how much volatility investors will tolerate to achieve long-term gains. Every investor needs to assess their own risk tolerance, of course. But the (admittedly less dramatic) movements in equities and commodities over the past two weeks are telling. Most of the quick downturns (such as U.S. stocks’ May 19 slide) were just as quickly reversed. Inflation concerns are the standard explanation for equity selloffs, but the reason for same-trading-day recoveries was less clear.
Have equity markets been so resilient because global household savings are an astounding $5.4 trillion above pre-pandemic levels? These excess savings are equal to 6% of global GDP and, according to an April 19 CNN Business report, greatest in countries where lockdowns and government support were most significant, such as the U.S. ($2.6 trillion, or 12% of GDP) and U.K. (10% of GDP). Indeed, there seems to be a tug-of-war between potentially negative news flow and where to deploy cash. What’s distorted? What’s real? We continue to favor a balanced equity portfolio comprising value and cyclical stocks as well as big-cap quality growth stocks. But we also expect volatility to continue.
How much inflation is OK?
Often, on days when equities sell off due to “inflation concerns,” sectors normally hurt by rising interest rates are among the best performers. Moreover, interest rates largely remain within tight ranges. Perhaps this is the new “risk off” paradigm: As inflation concerns and input prices increase, some investors are more focused on possible margin compression in certain stocks and sectors. With over 90% of S&P 500 companies having reported their 1Q results, fully 175 cited “inflation” on their earnings calls—the most since at least 2010—led by industrials, consumer discretionary, financials, consumer staples and material. But as FactSet further noted on May 14, consumer staples and materials had the highest percentage citing higher prices. (Given the many uncertainties and nuances of how individual companies are affected by inflation, it’s critical to be more stock selective. (Indeed, we expect stock selectivity to become increasingly important, especially when the Fed becomes less accommodative.)
Goldman Sachs’s May 19 report cited similar numbers regarding commodity input costs and inflation, particularly in consumer staples, industrials, materials, household products, food products, auto, packaging, machinery and chemicals. Goldman also sees resilient wage growth—a key determinant to whether inflation will be temporary or more persistent—and continuing bottlenecks. Thus it’s becoming harder and harder to deny the breadth (and possible depth) of inflation.
Is stagflation still a thing?
Also worrisome is that as inflation concerns rise, economic growth rate expectations seem to be falling. Admittedly, some expected slower growth is due to bottlenecks, supply chain breaks, rising material costs, and the like. For example, this week’s disappointing U.S. housing starts report lay partly in builders delaying construction in hopes of falling input costs—but their overall sentiment remained quite buoyant. Shortages in industries such as semiconductors have led to over-orders and extended lead times to ensure adequate supply. This type of behavior leads to the boom-bust cycles chipmakers are known for, but it also creates uncertainty. Temporary production slowdowns might partly explain the recent drop in Citi’s Economic Surprise Index (comparing economic data with expectations) to its lowest level in a year. (May 19, 2021).

Source: Bloomberg – The Citi U.S. Economic Surprise Index Is Close to Going Negative for the First Time in Nearly a Year (05/19/2021)
What does slowing economic growth and rising inflation sound like? The short answer is—break out the history books—“stagflation.” If such trends continue, the probability of stagflation will increase. This is something we will monitor closely.
Rational exuberance
In general, this week’s U.S. economic data showed robust but slowing growth, sometimes accompanied by the highest prices seen in years. For example, manufacturing in the Philadelphia Fed’s district saw its highest current prices received index since May 1981. Similarly, the New York Fed’s Empire State Manufacturing Survey, released at the start of the week, showed record-setting rises in input and selling prices as delivery times lengthened. Firms in the New York area remained optimistic about the next 6 months. U.S. jobless claims continued their weekly march to new pandemic lows.
Meanwhile, the NAHB survey showed steady homebuilder confidence even as some residential construction materials prices rose 12% vs. last year. Some builders even slowed their sales to help better manage their own supply chains. And even though housing starts fell short of expectations, building permits continued to rise. U.S. housing industry is low on inventory, and many economists expect that home prices could continue to increase for at least a few years.
Lean inventories typify other sectors as well. The most notable and most discussed, of course, is semiconductors. Goldman Sachs expects improved IT supply chain inventories in the second half of the year—but also that supply won’t meet demand until sometime in 2022. (May 19, 2021 report). Goldman also sees inflation expectations at a 15-year high.
On Friday the IHS Markit Flash U.S. PMI’s were announced. The Composite Output Index, the Services Business Activity Index, the Manufacturing PMI Index and the U.S. Manufacturing Output Index all registered record highs. Rates of input inflation were at a record high and output charges also increased at the fastest pace since 2009. Record rates of inflation in both goods and services were in response to “soaring” demand which boosted the pricing power of many firms. Severe lengthening of delivery times helped to drive inflation. Higher logistics, raw materials and higher fuel costs were also widely acknowledged as boosting inflation rates. Strong demand for goods and services was driven by increasing consumer confidence and reopenings progressing
A surprising stance on the Street?
How are money managers positioned relative to these observations? Bank of America surveyed 216 global fund managers with $625 billion AUM from May 7 to May 13. The result: Investors were increasingly positioned to “boom expectations”—exposures to commodities, banks, materials, industrials, the U.K. and emerging markets.


Source: Bloomberg – The Biggest Tail Risk in Markets Has Shifted (05/19/2021)
Shouldn’t they be worried given the trend of Citi’s Surprise Index? Probably not—if their stock holdings were scrutinized individually and their investing horizons are intermediate- to long-term. The percentage of survey respondents overweighting tech stocks was at a three-year low. Consumer staples positions were up since April. A third of those polled (35%) called inflation the top “tail risk” to their portfolios. Long Bitcoin was said to be the most crowded trade by 43% of respondents. And a record 69% saw a future of high growth and high inflation.
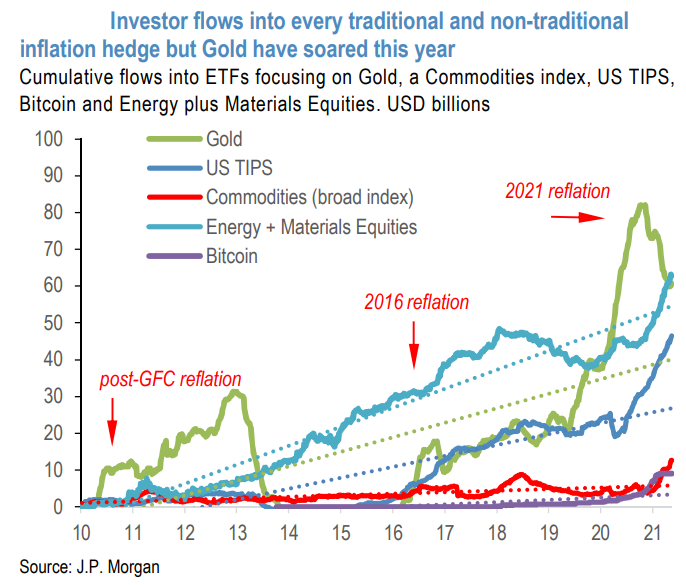
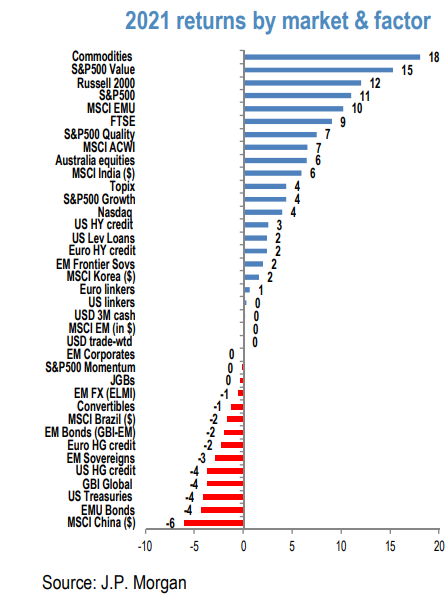
Which investments belong in a portfolio to counterbalance the risk of persistent rising inflation? According to JPMorgan (see the accompanying chart), real assets (commodities) should be considered—but gold was regarded as the worst inflation hedge. For its part, on May 14 Goldman Sachs concluded that energy is the best sector to own as inflation accelerates—whether moderately or sharply.


Source: The J.P. Morgan View – Pop go the bubblets (05/14/2021)
Consequential minutes
Perhaps the week’s biggest surprise came in the Federal Reserve’s April 27–28 meeting minutes, released mid-week: “A number of participants suggested that if the economy continued to make rapid progress toward the committee’s goals. It might be appropriate at some point in upcoming meetings to begin discussing a plan for adjusting the pace of asset purchases.” But in the meantime, Fed officials maintained their pledge to keep buying $80 billion in Treasuries and $40 billion in mortgage-backed securities every month until “substantial further progress” had been made on their employment and inflation goals. (Bloomberg May 19, 2021).
Some analysts called the meeting “stale,” as it had preceded the disappointing April U.S. employment numbers. Yet after the Fed released the minutes, Treasury yields rose, the U.S. dollar (DXY) gained about 0.5%, and equities, led by the tech sector, rallied from steep losses earlier in the day. Meanwhile, WTI, Brent and copper all lost over 3% on the day. The average decline for all base metals was 3.5%. Agriculture prices also closed lower. Earlier that same day China made clear its determination to curb “unreasonable” commodity prices.
Time for a pivot again?
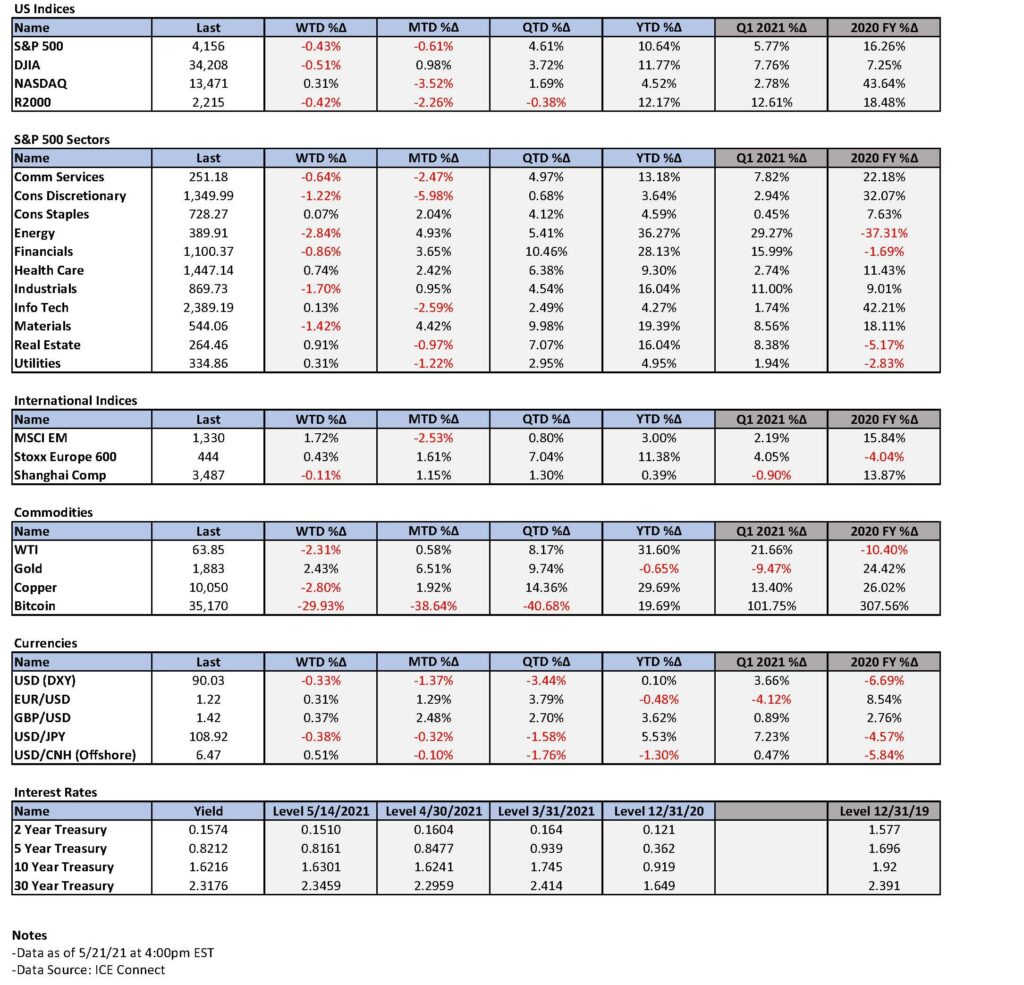
Although Nasdaq was Monday’s worst performer, the other major U.S. stock averages did not diverge much. Monday was the only day this week where the S&P sectors had a distinct cyclical/value tilt for the best performing sectors. Nasdaq was the best performer on May 18, which otherwise gave the advantage to a more defensive portfolio and it remained the best performing major U.S. equity average in subsequent days. This contrasts with last week when Nasdaq was the worst performing average as well as the worst for May through last week. Tech was the second worst S&P 500 sector performer during those same time frames. But Nasdaq reverted to being the worst performing U.S. equity index and tech was one of the worst sectors in response to the extremely strong PMI business activity and very strong inflation data announced on Friday. Outperformance once again reverted to a more value/cyclical oriented portfolio. But for the week, a more defensive oriented portfolio would have still outperformed. There was virtually no change in interest rates and the USD had a modest gain. At least for the time being, interest rates don’t appear to react to even very surprisingly strong economic and inflation data. They seem to now only respond to the perceived intentions of the Fed. Perhaps an interim shift is beginning to take place this week. We will continue to monitor developments closely. This is why it’s advantageous to have a balanced equity portfolio.
Bottom line
How is this recovery different from that of the Great Recession—and most every other recovery? The answer is mostly about speed, both on the way down and the way back up. The quickness (and amount) of governmental assistance, of course, continues to be critical.
The speed of disruptions—and rebounds—have led to worker dislocations, supply chain disruptions and mismatches of employees to job vacancies. People and businesses simply need more time to adjust to the new realities. The result is widespread inflation.
There’s a very good chance that those disruptions could lead to an explosive cycle of capital expenditures. Companies need to quickly increase their CapEx to take better advantage of supply shortages. By contrast, the very slow recovery from the 2008 recession saw little need to speed up CapEx—and led to a years-long dearth of expenditures that laid the foundation for today’s dramatic shortages and price increases. That pattern could lead to more sustained inflation. But wage growth will tell the story of whether higher prices are temporary…or set for a long haul.


INDEX DEFINITIONS
KBW Nasdaq Bank Index (BKX): The KBW Bank Index is designed to track the performance of the leading banks and thrifts that are publicly-traded in the U.S. The Index includes 24 banking stocks representing the large U.S. national money centers, regional banks and thrift institutions.
MSCI EM Value Index: The MSCI Emerging Markets Value Index captures large and mid cap securities exhibiting overall value style characteristics across 27 Emerging Markets (EM) countries.
MSCI EM Index: The MSCI Emerging Markets Index captures large and mid cap representation across 27 Emerging Markets (EM) countries.
NASDAQ: The Nasdaq Composite Index is the market capitalization-weighted index of over 2,500 common equities listed on the Nasdaq stock exchange.
PCE: Personal Consumption Expenditures (PCEs) refers to a measure of imputed household expenditures defined for a period of time.
Russell 1000 Growth: The Russell 1000 Growth Index measures the performance of the large-cap growth segment of the U.S. equity universe. It includes those Russell 1000 companies with higher price-to-book ratios and higher forecasted and historical growth values.
Russell 1000 Value: The Russell 1000 Value Index measures the performance of the large-cap value segment of the U.S. equity universe. It includes those Russell 1000 companies with lower price-to-book ratios and lower expected and historical growth rates.
S&P 500: The S&P 500 Index, or the Standard & Poor’s 500 Index, is a market-capitalization-weighted index of the 500 largest publicly-traded companies in the U.S.
VIX: The VIX Index is a calculation designed to produce a measure of constant, 30-day expected volatility of the U.S. stock market, derived from real-time, mid-quote prices of S&P 500® Index (SPX℠) call and put options.
Z-Score: A Z-score (also called a standard score) gives an idea of how far from the mean a data point is. It is a measure of how many standard deviations below or above the population mean a raw score is.
IMPORTANT DISCLOSURES
The views and opinions included in these materials belong to their author and do not necessarily reflect the views and opinions of NewEdge Capital Group, LLC.
This information is general in nature and has been prepared solely for informational and educational purposes and does not constitute an offer or a recommendation to buy or sell any particular security or to adopt any specific investment strategy.
NewEdge and its affiliates do not render advice on legal, tax and/or tax accounting matters. You should consult your personal tax and/or legal advisor to learn about any potential tax or other implications that may result from acting on a particular recommendation.
The trademarks and service marks contained herein are the property of their respective owners. Unless otherwise specifically indicated, all information with respect to any third party not affiliated with NewEdge has been provided by, and is the sole responsibility of, such third party and has not been independently verified by NewEdge, its affiliates or any other independent third party. No representation is given with respect to its accuracy or completeness, and such information and opinions may change without notice.
Investing involves risk, including possible loss of principal. Past performance is no guarantee of future results.
Any forward-looking statements or forecasts are based on assumptions and actual results are expected to vary from any such statements or forecasts. No assurance can be given that investment objectives or target returns will be achieved. Future returns may be higher or lower than the estimates presented herein.
An investment cannot be made directly in an index. Indices are unmanaged and have no fees or expenses. You can obtain information about many indices online at a variety of sources including: https://www.sec.gov/fast-answers/answersindiceshtm.html or http://www.nasdaq.com/reference/index-descriptions.aspx.
All data is subject to change without notice.
© 2021 NewEdge Capital Group, LLC


